The Influence of State Industrial Profiles on Highway Asset Valuations in India
How does a state’s economy and industrial profile impact the value of its road infrastructure?
In transportation economics, the demand for transportation is defined as a “derived” demand. This means that the need for transportation as a service is typically a by-product of the need for other goods or services within the economy. For instance, workers commute to work, students travel to school, individuals travel to the market to buy groceries, hospitals to avail medical services, or even theatres to catch the latest movie – and thus the need for transportation arises. Therefore, it is the dynamics of underlying consumption and production patterns within an economy that influence the demand for travel, either by households or by businesses (via commercial transportation and/or business-related travel).
Drivers of Highway Asset Value
For toll road highway assets, and like all other assets, the value of the asset is determined by the Net Present Value (NPV) of all future cashflows generated by the asset. In the case of toll road assets specifically, these cashflows comprise toll collections on the highway. Tolls differ by vehicle type – the larger and heavier the vehicle, the higher the toll rate charged.
Notwithstanding other sources of revenue (such as penalties on overloaded vehicles), the future cashflows generated by an asset are thus determined by two primary variables – the toll rate charged, and the volume of traffic plying on the asset. Toll rates are typically inflation-indexed and escalate every year based on pre-determined formulae set by the government, meaning they are highly regulated and do not include much risk. Traffic volumes, on the other hand, do represent risk since several different factors influence the potential for future traffic growth on any given highway.
Some of these factors include:
- General economic conditions – macroeconomic and regional economic factors
- Regional transportation network – whether the asset provides transportation access between regions that are poorly connected by other infrastructure, or well connected by other alternatives
- General Asset Condition – is the asset in sufficiently good condition for frequent commercial use? Does it provide ancillary infrastructure (rest stops) for commercial drivers/transporters?
- Compliance and Enforcement – whether the asset had adequate infrastructure to reduce revenue leakage including appropriate toll plaza configurations to eliminate micro-diversions (whereby users bypass tolling gates via short routes off the highway), appropriate machinery to identify and charge penalties for overloaded vehicles, and - where required - additional local law enforcement support to ensure minimal disruption to tolling operations from locals.
The above constitute some of the major factors that influence the overall growth of traffic (and hence revenue) on a given asset. They also determine, in many cases, the composition and movement patterns of traffic volumes on the asset. In the section below, we discuss how regional industrial profiles can significantly influence the valuation of a highway asset located in or around that region, or one that provides critical transportation access between two or more such regions.
State-wise Value Added by Economic Activity
To understand how different economic activities are concentrated and distributed across the country, Figure 1 below presents state-level maps of India, where each map shows the contribution of different states to the overall national GVA1 in a select set of economic activities.2
Figure 1: State-wise Contribution to National GVA in Select Economic Activities
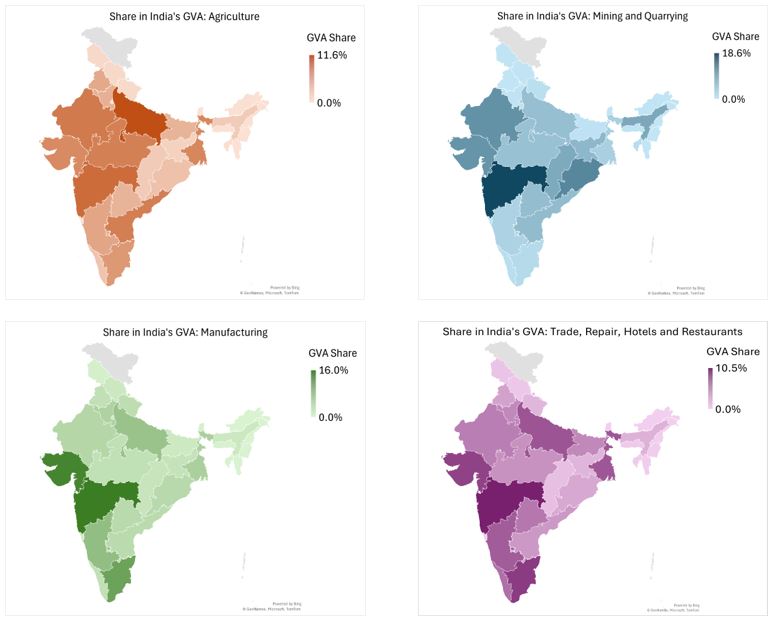
Source: Steer Analysis of MoSPI data; GVA shares for each state in each of the selected economic activities represent the average share over the period FY2012 to FY2024.
From Figure 1 above, we can make some high-level observations. Maharashtra appears to be a powerhouse state in India, consistently accounting for a high share of GVA contribution across all three broad types of economic activities, including in Mining & Quarrying (primary), Manufacturing (secondary), and Trade, Repair, Hotels & Restaurants (tertiary). Since FY2012, states like Karnataka, Tamil Nadu, and Gujarat have each contributed significant shares of overall national GVA in the Manufacturing, Trade, Repair, Hotels & Restaurant sectors, while Rajasthan, Gujarat, Orissa, and Assam have shown similar contributions in the Mining & Quarrying sector over the same period.
In Agriculture, Forestry, and Fishing, however, the contribution of different states to national GVA in the sector is more distributed, with Uttar Pradesh leading all states; states like Chhattisgarh, Odisha, and Jharkhand show less significance in their contributions to national GVA.
State-wise value concentration by Economic Activity
In addition to understanding each state’s contribution to national GVA in a specific sector or economic activity as described above for a select few types of activities, it is important to analyse how each of these economic activities are also concentrated within a given state. This idea of regional concentration or regional specialisation is a standard concept in regional economics typically represented by what is called a Location Quotient.
Location Quotients (or “LQs”) measure the concentration of a particular industry or economic activity in a specific geographic region when compared to the nation (or a wider geographic region). Typically, this measure is calculated using either employment by industry, the number of commercial establishments by industry, or total annual wages paid by industry. In this report, we developed a modified version of the LQ using value added by industry/economic activity as the building blocks for calculating state-wise LQs for different types of economic activities. Figure 2 below presents state-level maps of India, where each map shows the level of specialisation each state exhibits in each of the selected economic activities.
From Figure 2 below, we make slightly different observations than those made for the same set of economic activities in Figure 1 above. For example, while Uttar Pradesh, Maharashtra, and Rajasthan have historically (over the period FY12-24) been the largest contributing states to national GVA in the Agriculture, Forestry, and Fishing sector, the state economies of Madhya Pradesh, Arunachal Pradesh and Andhra Pradesh exhibit higher levels of economic specialisation in this industry, with Location Quotients as high as 2.1 in Madhya Pradesh.
Similarly, when we analyse the Mining and Quarrying sector, Maharashtra has historically contributed to roughly 19% of India’s total GVA in the sector since FY12 – the highest of all the states across the country and followed by Odisha and Rajasthan at 11% and 10% respectively. However, Maharashtra’s state economy is far less concentrated in the Mining and Quarrying sector than several other states in India; Assam, Odisha, Chhattisgarh, and Jharkhand show significant levels of regional economic specialisation in this sector.
In the Manufacturing sector, some of smaller state economies like Uttarakhand, Goa, and Sikkim - which collectively accounted for roughly 4% of total national GVA in the Manufacturing sector between FY12 and FY24 - exhibit significantly higher levels of regional specialisation in this sector relative to large state economies like Maharashtra, Tamil Nadu, and Karnataka. Similar to Odisha for Mining and Quarrying, Gujarat is an example of a state that is both a large contributor to national GVA in the Manufacturing sector and one that is highly specialised in the same.
Similar to our conclusions for the Manufacturing sector, we see that small economies of Chandigarh, Meghalaya, Bihar, and Manipur exhibit far higher levels of economic specialisation in the Trade, Repair, Hotels & Restaurants sector than large contributing states such as Maharashtra, Tamil Nadu, Gujarat, and Uttar Pradesh. Kerala and West Bengal are two states that show both high contributions to national GVA and high levels of regional specialisation in this sector.
Figure 2: State-level Regional Specialisation in Select Economic Activities (in GVA terms)
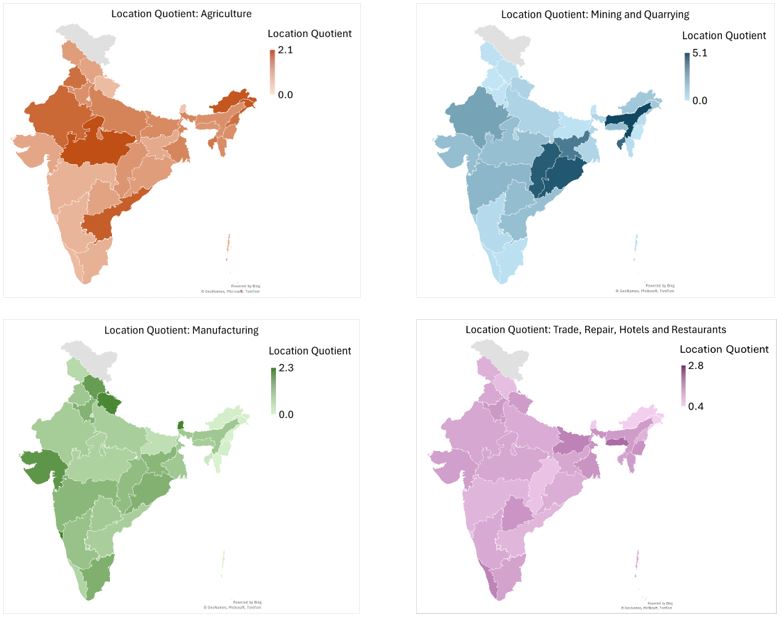
Source: Steer Analysis of MoSPI data; GVA-based Location Quotients in selected economic activities represent average value over the period FY2012 to FY2024
Conclusion
From the above analysis, one can quickly start to see how different state economies and their industrial profiles may influence economic activity within the states, and subsequently, the derived demand for transportation resulting from those types of economic activities. In summary:
- There are two ways to view relative importance of different economic activities / industrial sectors within a specific region, whether a country, state, or district (within a state) – one being how much that region contributes to the overall wider economy in a specific sector, and another being how important that sector is within the region’s overall industrial profile itself.
- Both these metrics help determine which are the main industries within a state, and likewise, which main types of economic activity drive significant value generation within the state. Regional specialisation in a specific activity implies that a state’s competitive advantage in that sector is relative to other states. States which exhibit higher specialisation in one type of activity typically export goods and services of that sector to other importing states, which in turn influence commercial transportation patterns between the two.
- Thus, highway assets that serve as strategic or critical road infrastructure connecting production centres in one state to consumption centres in other states are dependent on the industrial make-up of the states that they connect as this industrial profile often determines the type of traffic on the asset, as well as the growth of traffic volumes on the asset.